How to use TogoDX/Human
Principle of integrated data exploration
- DBCLS has been building RDF Portal, a portal site that brings together a variety of life science data in a unified format (RDF). Using it, we collected 65 attributes from 20 databases, which had so far been published separately, covering 8 categories: genes, proteins, 3D structures, interactions, compounds, glycans, diseases and variants (as of August 2023).
- Each collected attribute is organized by the IDs of its own dataset, such as gene IDs or compound IDs. To enable the integrated exploration of these data, the system converts IDs between datasets whenever necessary.
- The links between datasets used for ID conversion are built on the data of TogoID, an ID conversion service that stores the relations between IDs of life science datasets, and an appropriate conversion route is set for each pair of datasets (Figure 1).
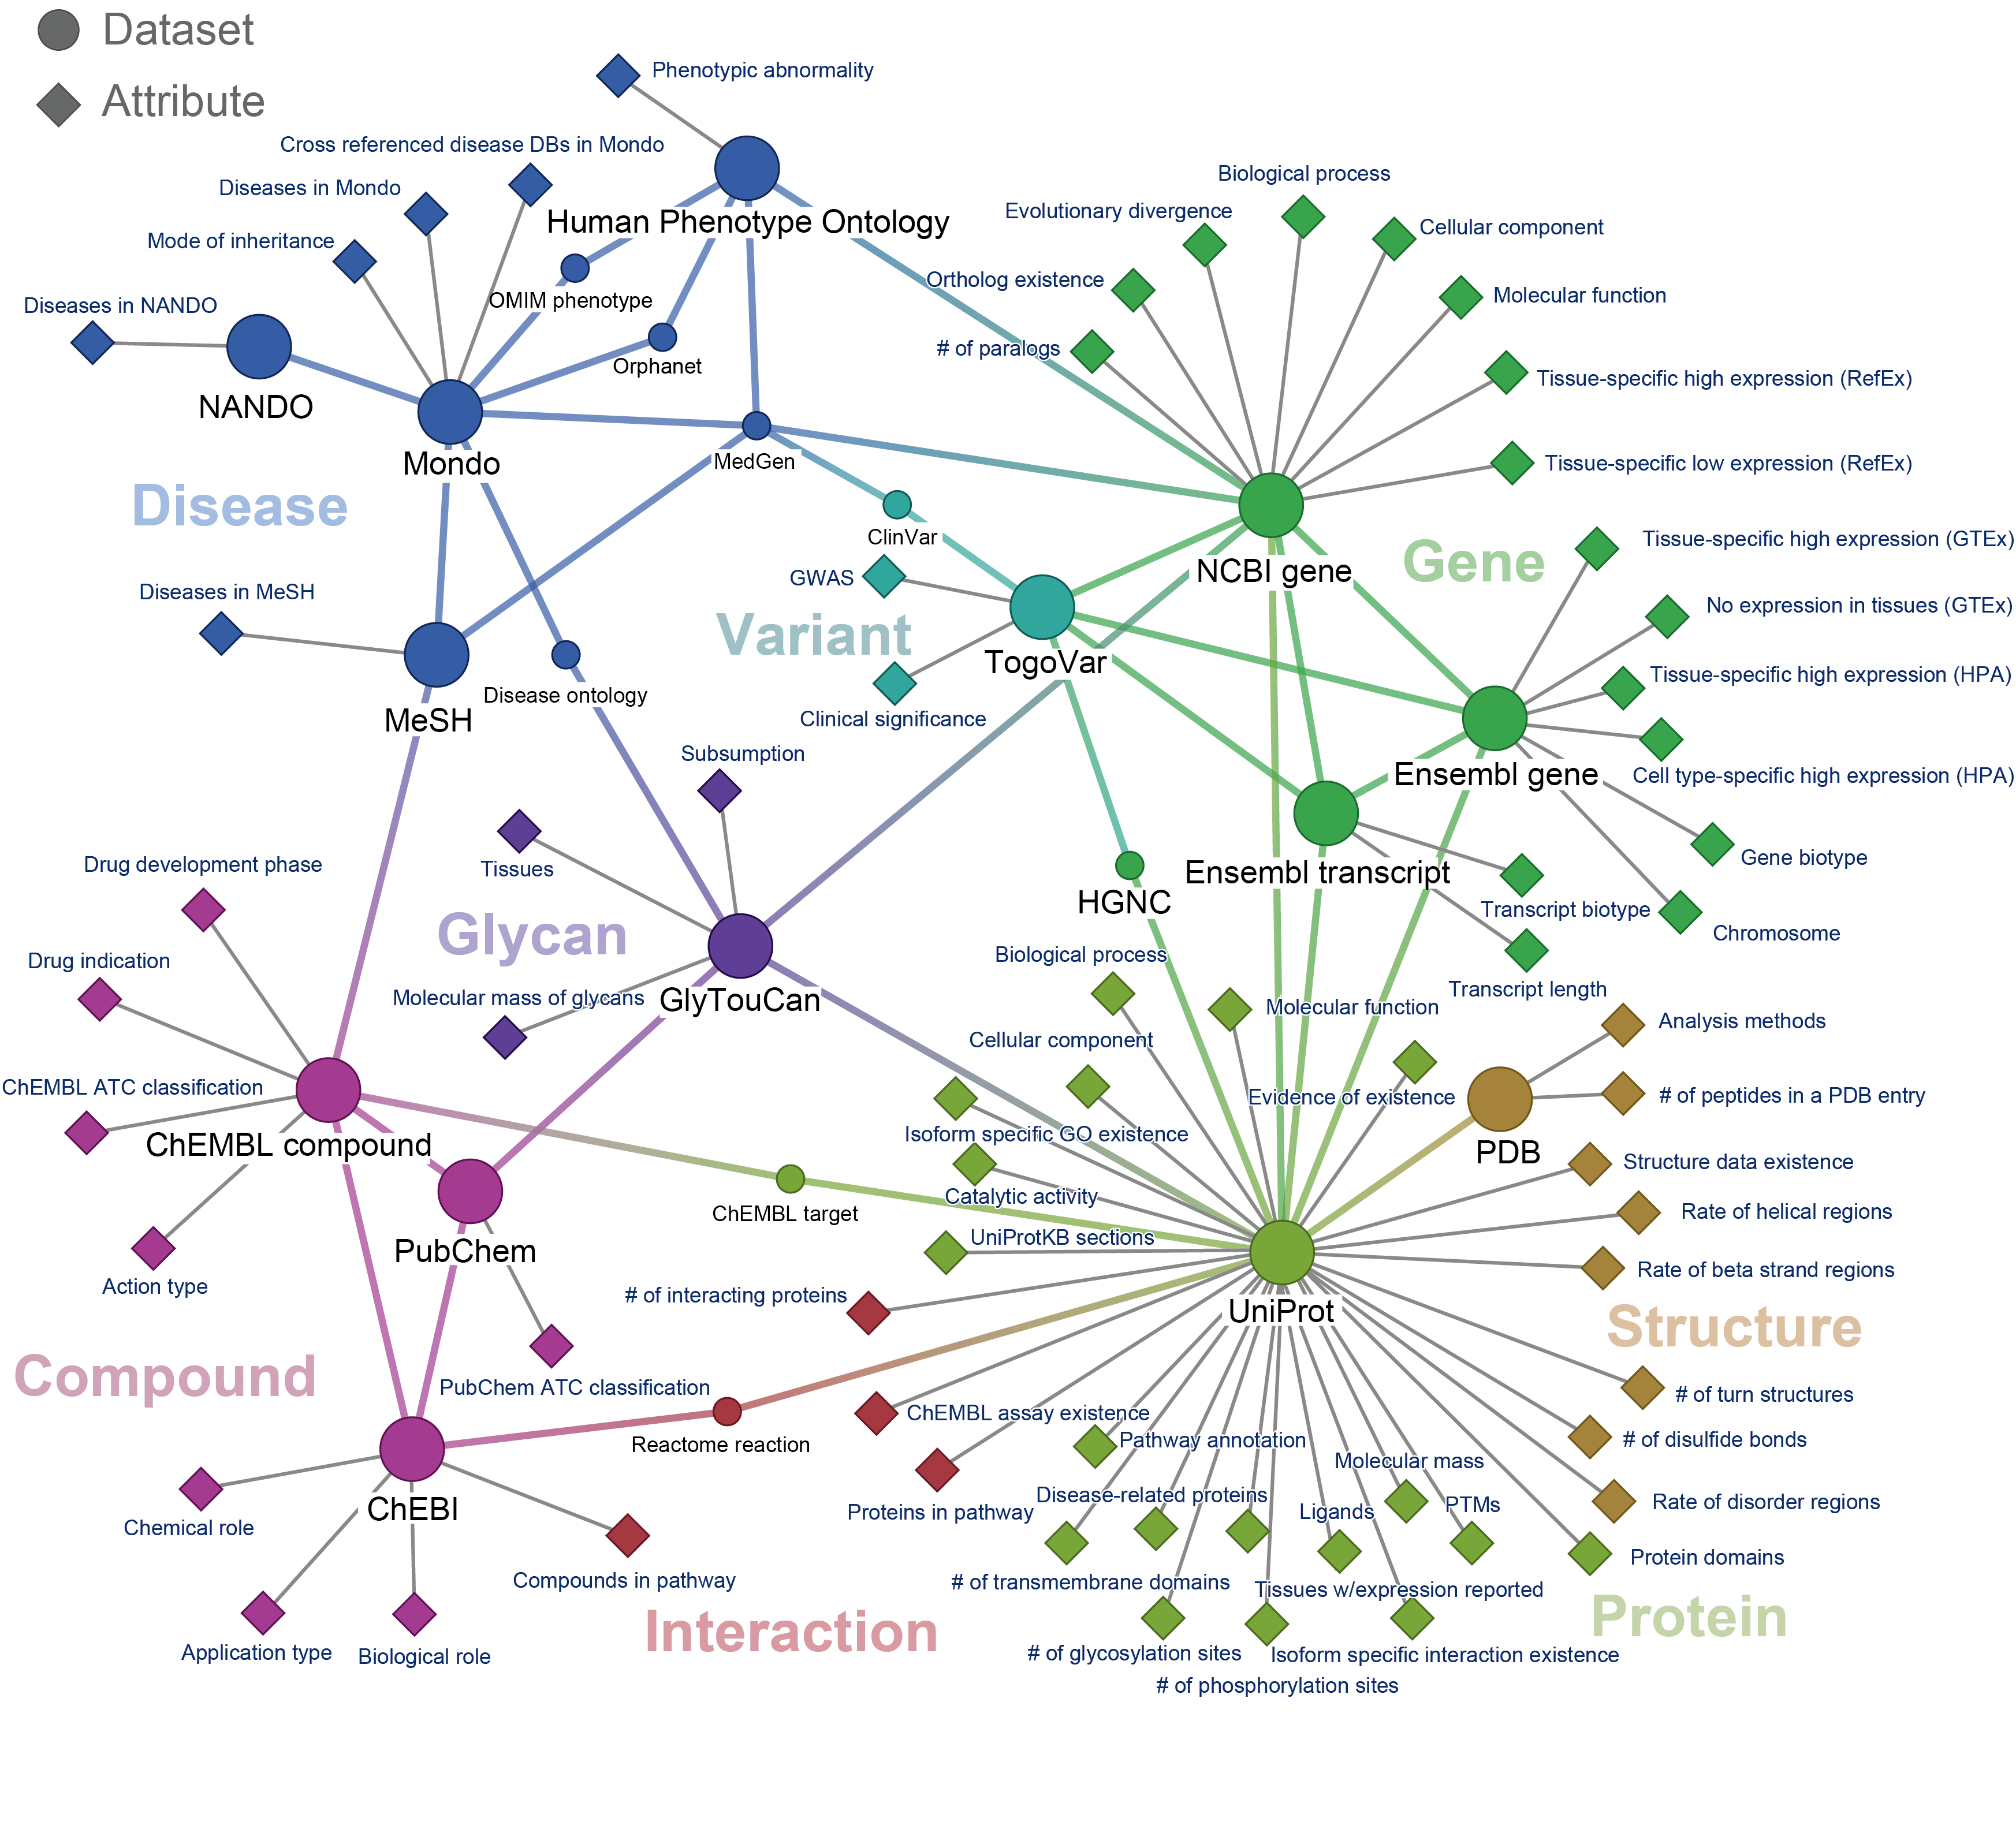
- Figure 1. Relations between the datasets and attributes included in TogoDX/Human
- Large circles represent the target datasets, and the links for ID conversion are drawn between them. Rectangles represent attributes, which are keyed by the IDs of the dataset they are connected to. The eight colors represent the category that a dataset or attribute belongs to. This figure shows that the diverse attributes are integrated through the links between the IDs that serve as their keys.
- Diagram of the ID link relations between the datasets used in TogoDX/Human
Layout of the top page and working with attributes
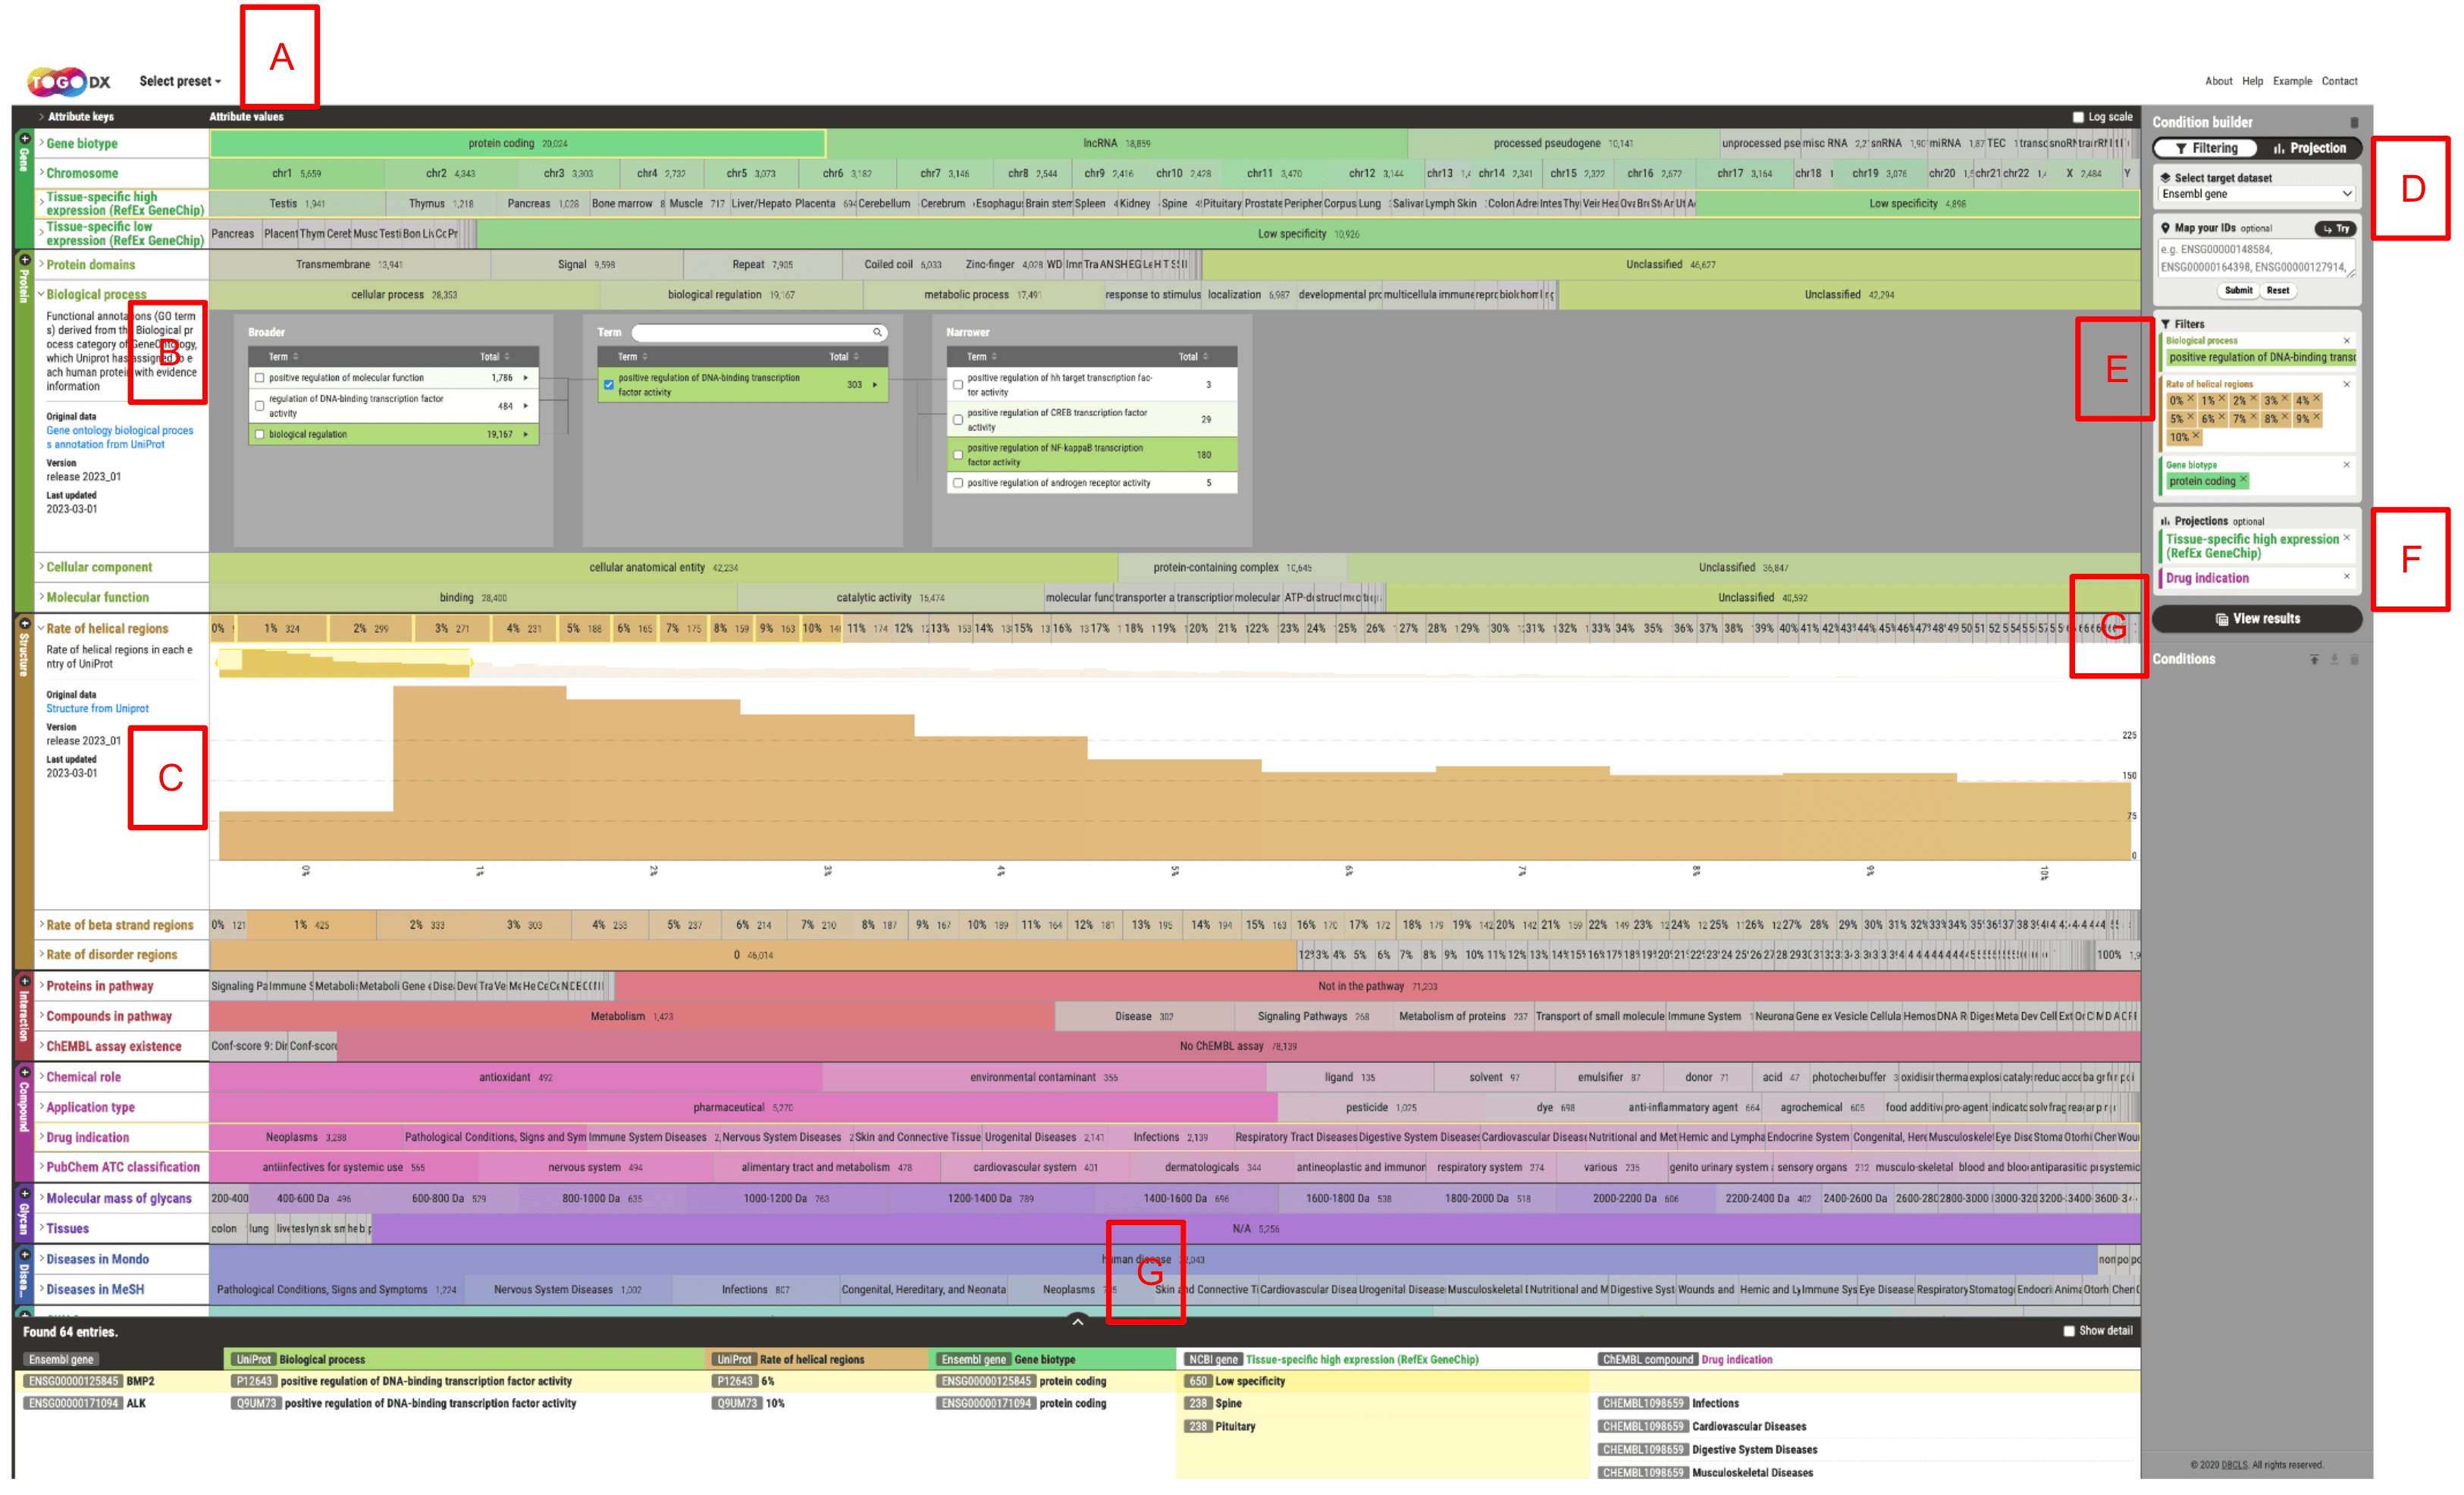
- Figure 2. Distribution and breakdown of each attribute, as overviewed from the top page of TogoDX/Human
- On the Explorer screen (top page), characteristic annotations such as gene expression patterns and protein localization are represented as
"Attributes" (Figure 2).
- In the initial state only a preselected set of representative attributes is displayed, but you can customize the displayed attributes to suit your needs by adding attributes per category or by selecting an attribute preset. The customization is remembered by your browser (Figure 2A).
- Each attribute is shown as a 100% stacked chart of the composition (breakdown) of its items, so that you can narrow down the data with the attributes you are interested in while getting an overview of all the data, and see what proportion of the whole dataset is not annotated.
- Attributes can be expanded. For a hierarchical classification, a column browser is displayed in which you can check the distribution in the lower levels (Figure 2B); for a distribution of continuous values, a histogram lets you check the distribution intuitively (Figure 2C).
Exploring data by narrowing down, and obtaining the results
- Select the dataset you want to target from
"Select target dataset" (Figure 2D).
- The data exploration is carried out using the ID links centered on the selected dataset.
- In
"Filtering", you can set the conditions for narrowing down the data by selecting the classifications or values of each attribute, and obtain the list of IDs of the dataset that satisfy the conditions (Figure 2E).
- From the column browser, you can add lower levels to the narrowing-down conditions (Figure 2B).
- From the histogram, you can add a range to the narrowing-down conditions by selecting it (Figure 2C).
- In
"Projection", you can examine the distribution within the ID list by mapping the attribute hierarchies you are interested in onto the dataset IDs narrowed down by Filtering (Figure 2F).
- This increases the chances of new discoveries and of new interpretations of the data.
- When you perform Filtering or Projection, a preview table of the dataset IDs that satisfy the conditions appears at the bottom of the screen, and a column is added each time you add a condition.
- Clicking the arrow icon at the top of the table, or
"View results", switches to the Results screen (Figure 2G).
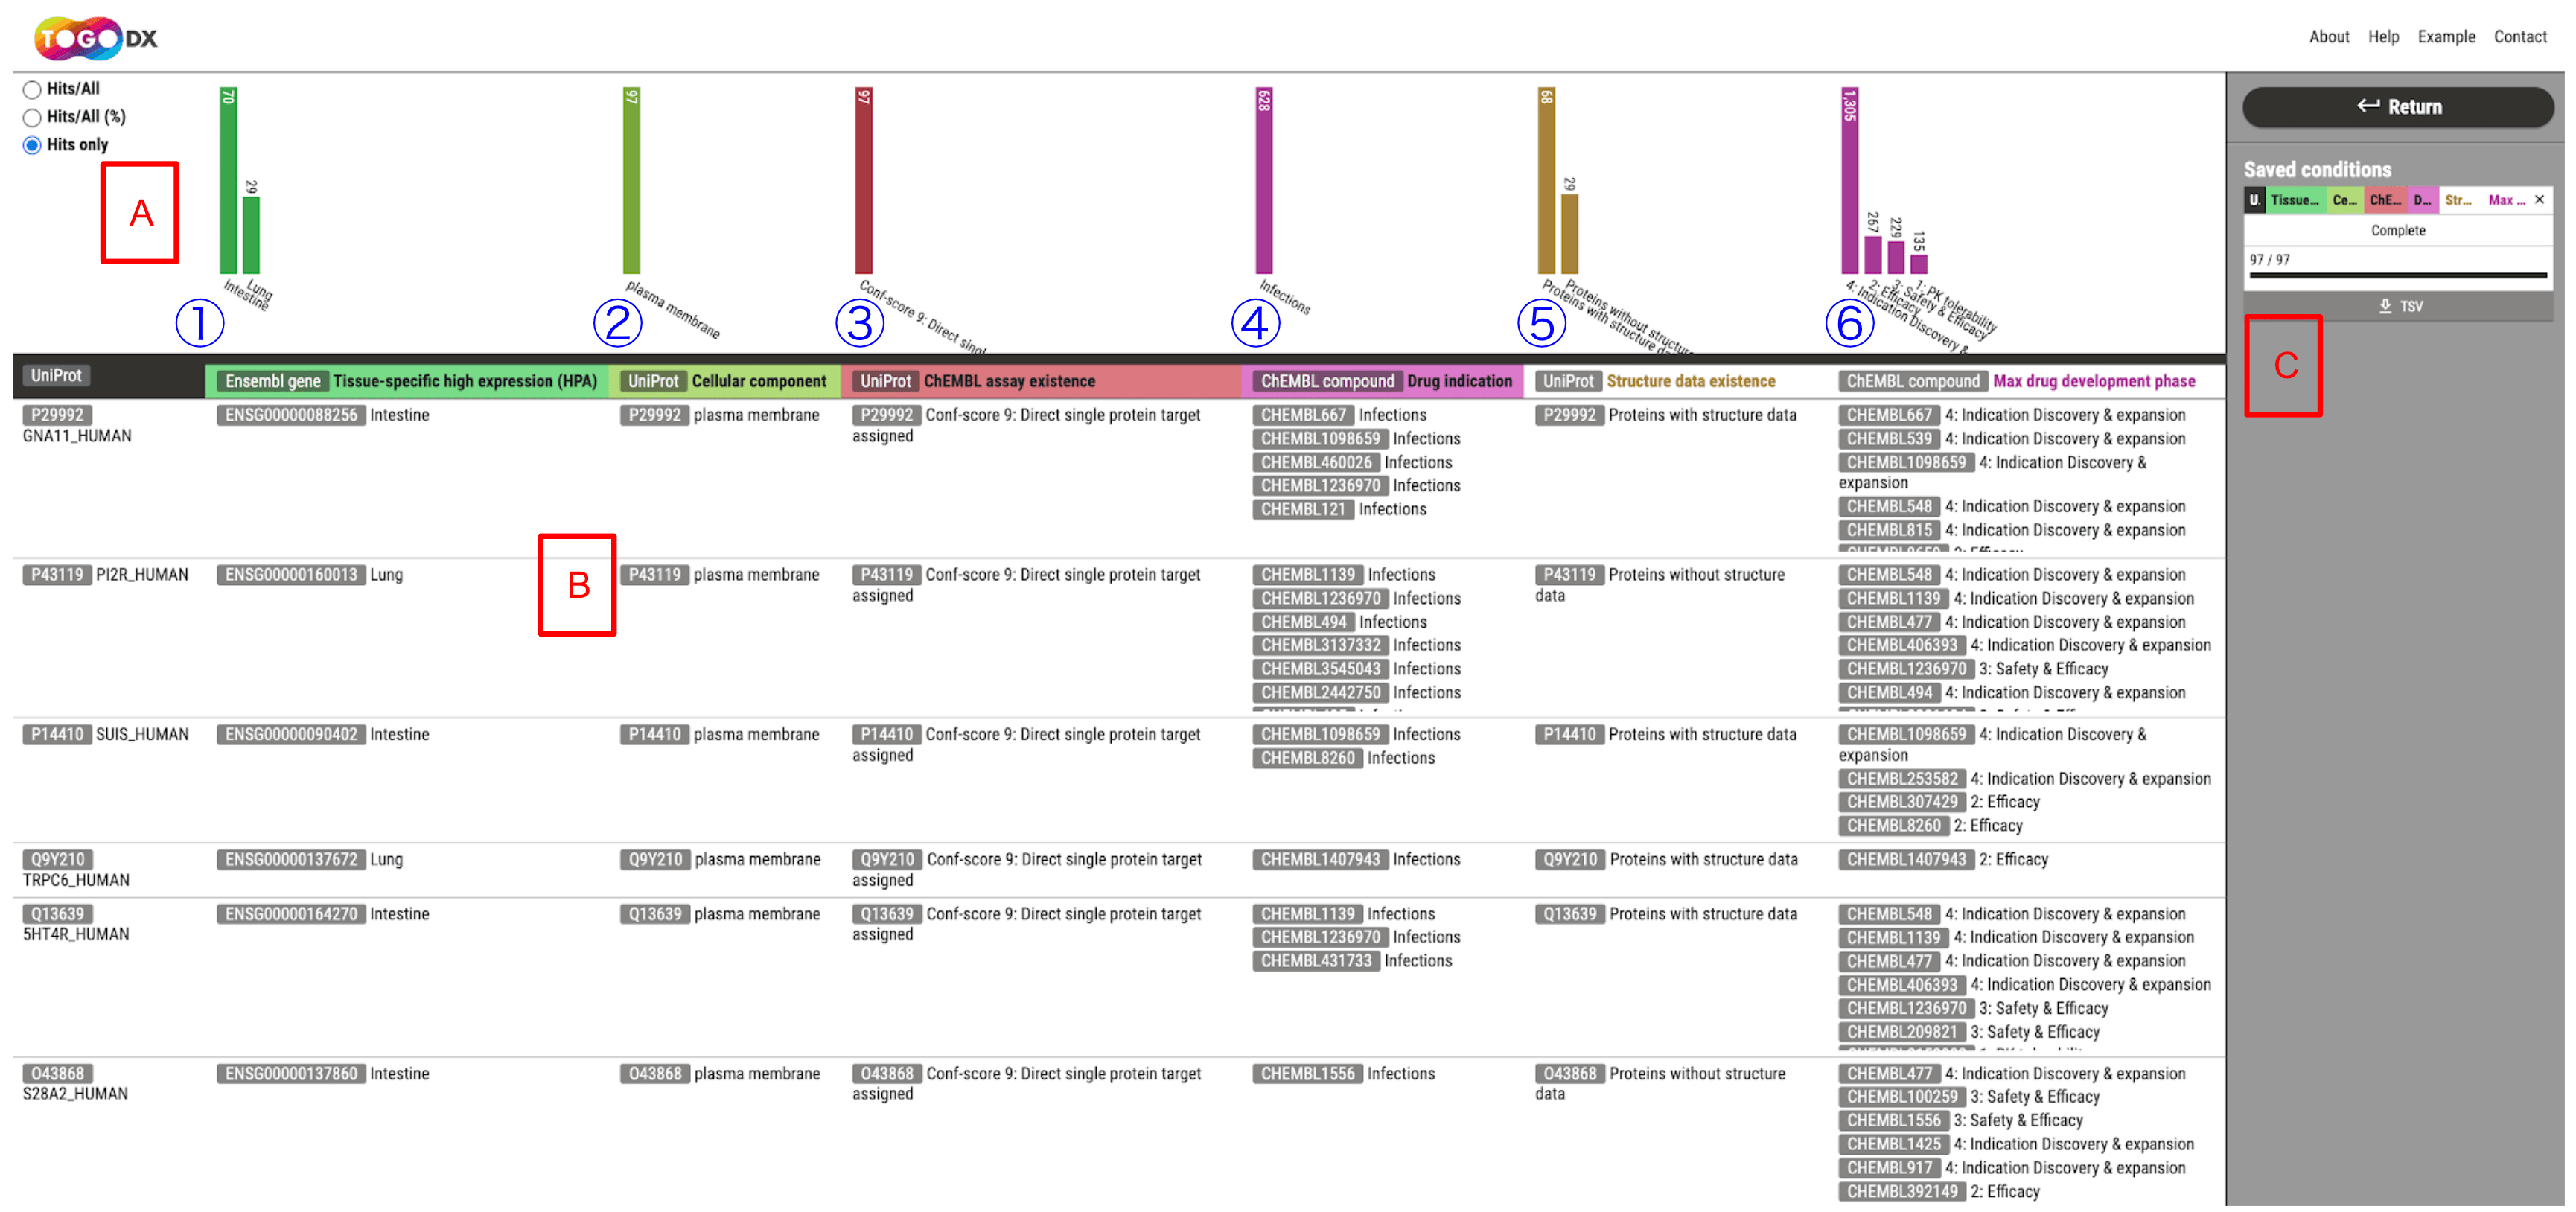
- Figure 3. Example of the results of a data exploration narrowed down with the
"Filtering" and "Projection" functions
- On the
"Results" screen, you can view as a table the list of target dataset IDs that match the narrowing-down conditions, together with the information on the attributes used for Filtering and the breakdown of the attributes specified for Projection (Figure 3).
- Above the table, charts of the breakdown of the search results are displayed, so that you can see the distribution visually (Figure 3A).
- You can evaluate the distribution and bias by switching the display between the number of IDs satisfying the conditions out of the total of each item, its percentage (%), and the actual number of IDs satisfying the conditions.
- Clicking a dataset ID shown in a cell lets you check the detailed annotation information related to that ID (Figure 3B).
- The exploration results can be downloaded as a TSV file, so that you can carry out more detailed data analysis in analysis environments such as JupyterLab or Google Colaboratory (Figure 3C).
- Search conditions in TogoDX/Human can be exported and imported as a JSON file, and shared with other users to reproduce the search.
〈Example of a data exploration with these operations〉
“Investigate the development status of drugs targeting genes/proteins that show a similar expression pattern”
- One of the features of TogoDX/Human is that complex search conditions can be realized within a single application.
- In this example, we obtain the list of human proteins that satisfy the following conditions.
- ① Tissue-specific high gene expression has been observed in the lung or intestine
- ② As a protein, it is localized on the plasma membrane
- ③ Data exist from a method that detects a direct interaction between the protein and some compound
- ④ It is related to a compound that is effective against “infections”
- Simply by finding the search conditions ①–④ in the attributes and adding them as filtering conditions, you obtain an ID list of the 97 proteins that satisfy all the conditions (Figure 3).
- Next, with the Projection function you can examine how the group of proteins obtained by narrowing down is distributed in other attributes or in parts of their hierarchies.
- In this example, the proteins are classified by the following conditions.
- ⑤ Whether protein 3D structure data exist in PDB
- ⑥ The maximum development phase of the compound across all indications in ChEMBL (research stage, Phase 1–3, post-marketing)
Overviewing data by ID mapping
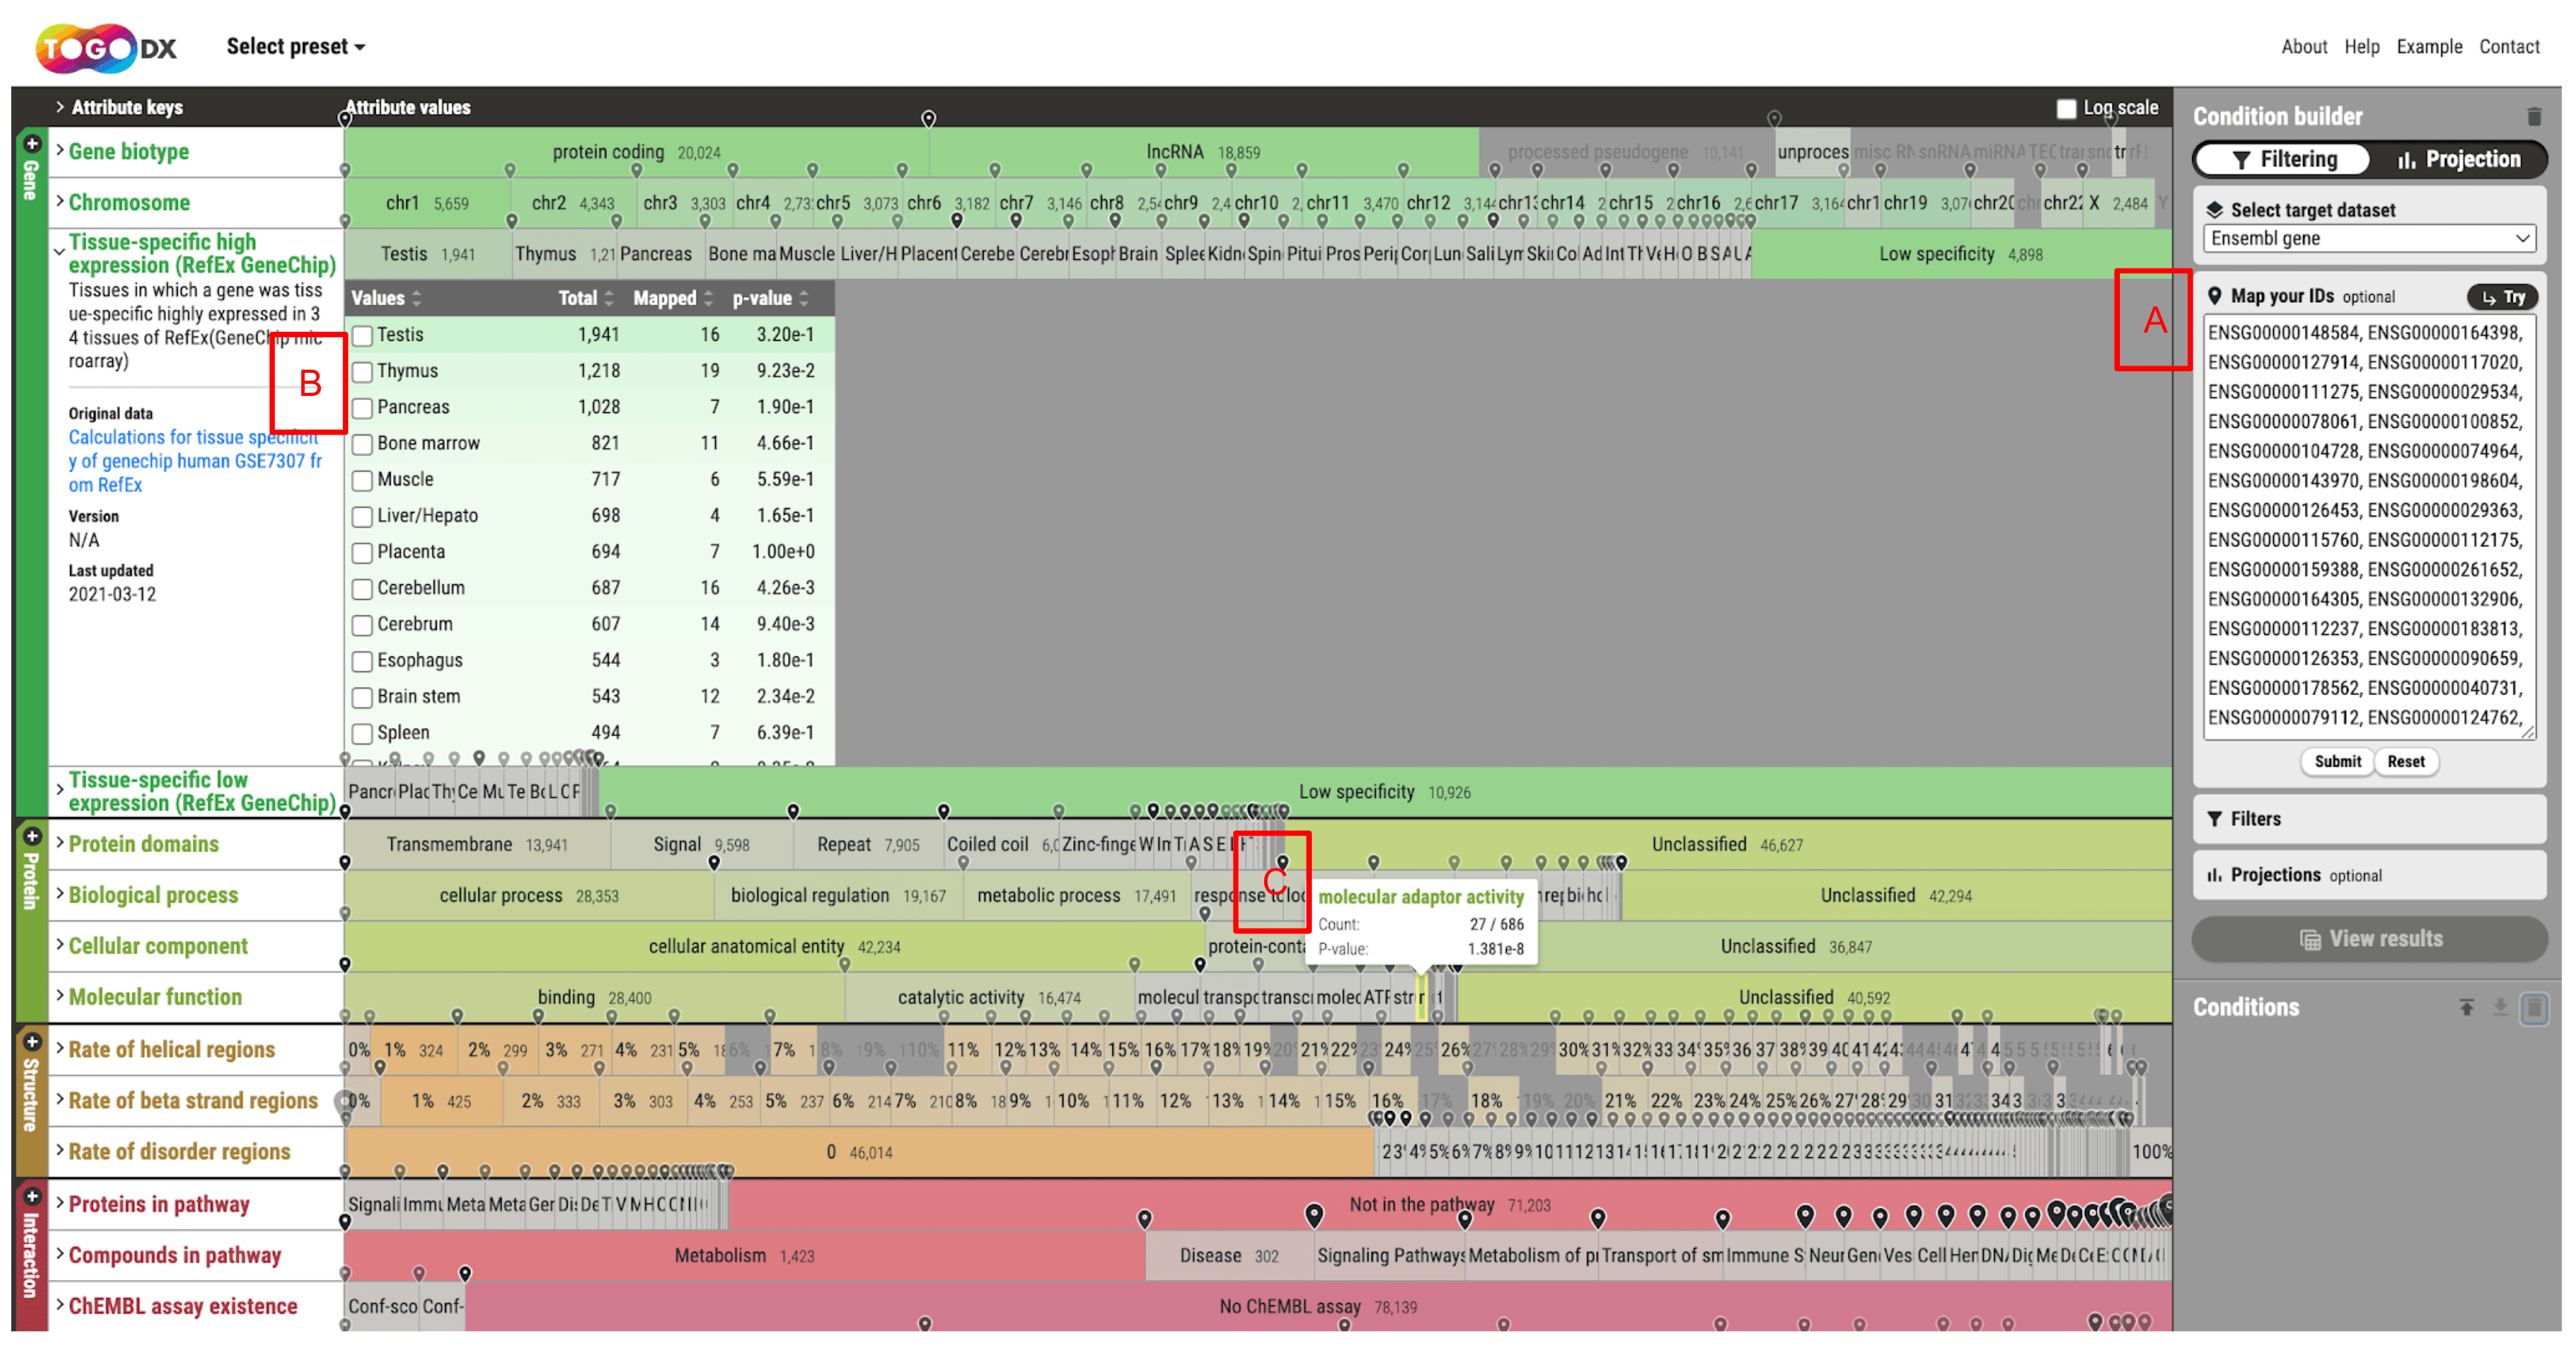
- Figure 4. Example of overviewing data by ID mapping
- With
"Map your IDs", you can perform a simple enrichment analysis against each attribute by entering your own ID list.
- When you enter an ID list in the text area and submit it (Figure 4A), the IDs are converted for each attribute, and the number of IDs corresponding to each item and its p-value are calculated (Figure 4B).
- Items that contain corresponding IDs are marked with a pin, and items that contain none are grayed out, so that you can check the distribution and bias visually. The mapping can also be used as one of the filters for narrowing down.
〈Example of a data exploration with these operations〉
- COSMIC (Catalogue Of Somatic Mutations In Cancer) is a database that accumulates information on somatic mutations associated with cancer.
- This database maintains the Cancer Gene Census (CGC), a catalog of genes containing mutations that have been suggested to be causally related to cancer.
- Among them, the Tier 2 group contains 158 genes whose role in cancer is strongly suggested but for which the available evidence is insufficient.
- These are available from the
"Try" button as an example of running Map your IDs with Ensembl gene IDs on TogoDX/Human (Figure 4A).
- For example, you can immediately see the classification of the tissues in which these 158 genes are specifically highly expressed (Figure 4B).
- It is also easy to classify them by molecular function using Gene Ontology (Figure 4C).
Others
About
- Link to an overview of TogoDX/Human
Help
- Link to explanations of the terms and functions of TogoDX/Human
Example
- Link to explanations of concrete use cases of TogoDX/Human
Contact
- Inquiries about TogoDX/Human
Resetting
- On startup or reload, the whole screen returns to its initial settings.
- Clicking the
TogoDX logo at the top also returns it to the initial settings.
- Clicking the
Clear button of the Condition builder resets the search conditions.